
What it is
Chrome DevTools MCP is an official MCP server from the Chrome DevTools team that enables coding agents to control and inspect live Chrome browsers. It provides three core capabilities: performance insights (recording traces and extracting actionable data), advanced debugging (analyzing network requests, capturing screenshots, examining console messages with source-mapped stack traces), and reliable browser automation using Puppeteer with automatic result waiting. The server supports two modes: full mode with access to all Chrome DevTools capabilities, and a slim mode (via the --slim flag) for basic browser tasks with a reduced tool surface and optional headless operation. The browser launches automatically when tools are invoked -- simply connecting to the MCP server does not start Chrome. Configuration guides are available for Claude Code, Cursor, VS Code, and Antigravity. Advanced features include concurrent browser sessions, persistent data directories, remote Chrome debugging, and Android device support. Data collection is enabled by default but can be disabled via the --no-usage-statistics flag. The server can also be integrated as a browser subagent component within larger agentic tools.
Who it's for
- web developers
- performance engineers
- QA engineers
- frontend developers
Requirements
Requirements
- Node.js LTS
- Chrome (current stable or newer)
- npm
Setup
Step 1
bashAdd to MCP client config: {"mcpServers":{"chrome-devtools":{"command":"npx","args":["-y","chrome-devtools-mcp@latest"]}}}
خادم MCP يمنح وكلاء البرمجة وصولا كاملا إلى أدوات مطور Chrome لتحليل الأداء والتصحيح وأتمتة المتصفح.
Examples
Check site performance
PromptCheck the performance of https://developers.chrome.comExpected output: Launches Chrome, records a performance trace, and returns actionable performance data.
Pros & cons
Pros
- Pro:Official Chrome DevTools team project
- Pro:Full performance traces with actionable insights
- Pro:Advanced debugging: network requests, screenshots, console messages with source-mapped stack traces
- Pro:Slim mode available for basic browser tasks with reduced tool surface
Cons
- Con:Exposes browser content to MCP clients; avoid sensitive information
- Con:May send trace URLs to Google CrUX API for real-user data by default
Related
 Skill
Skill ecc
Harness-native ECC operator layer - 71 agents, 302 skills, 95 legacy command shims, reusable hooks, rules, selective install profiles, and production-ready workflows for Claude Code, Codex, OpenCode, Cursor, and related agent harnesses
 Skill
Skill code-review
Automated code review for pull requests using multiple specialized agents with confidence-based scoring to filter false positives
 Skill
Skill commit-commands
Commands for git commit workflows including commit, push, and PR creation
 Skill
Skill ralph-wiggum
Interactive self-referential AI loops for iterative development. Claude works on the same task repeatedly, seeing its previous work, until completion.
 Skill
Skill asana
Asana project management integration. Connects Claude Code to Asana's V2 MCP server to create and manage tasks, search projects, update assignments, and track progress. Requires a one-time Asana OAuth app setup — run /asana-setup after installing.
 Skill
Skill claude-code-setup
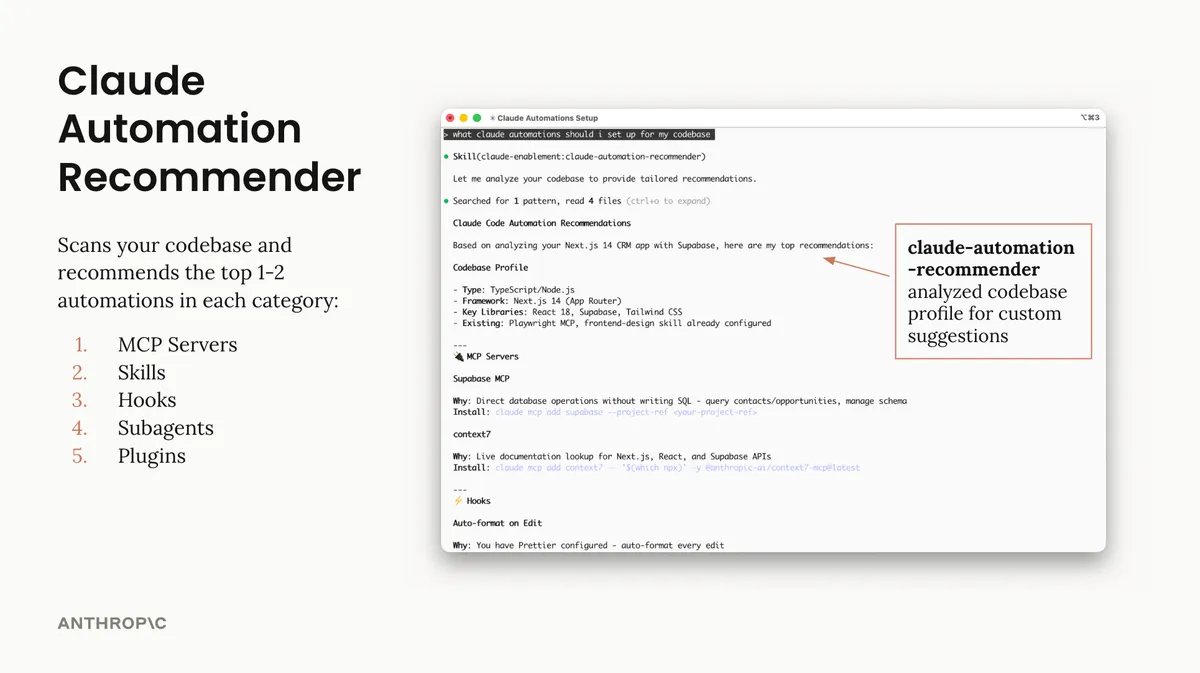
Analyze codebases and recommend tailored Claude Code automations such as hooks, skills, MCP servers, and subagents.